
🔍 Read the full analysis: OlmoEarth V1.3 Brings Advanced Embeddings To Global Earth Data on ThorstenMeyerAI.com

Get the latest gadgets delivered free with Prime
- Fast, free delivery on millions of items
- Prime Video, Amazon Music and more included
- Member-only deals all year
TL;DR
The OlmoEarth team released v1.3 of its satellite embedding model, annual global data at 10-meter resolution and a browser-based explorer. The team says the model ranked highest on 20 of 27 evaluations, but those results have not been independently verified in the supplied source material.
As detailed in the original analysis, the OlmoEarth team has released version 1.3 of its satellite embedding model, alongside annual global embeddings at 10-meter resolution and a browser-based map explorer. The developers say the model ranked highest in 20 of 27 evaluations, but those comparisons are the team’s own results and have not been independently verified in the supplied material.
OlmoEarth v1.3 processes yearly satellite-image time series drawn from Sentinel-1 radar and multispectral imagery from Sentinel-2 and Landsat. It produces a 128-dimensional numerical representation, or embedding, for each 10-meter pixel. The first 64 dimensions can also be used as a smaller representation. The team says the precomputed global data is available through Source Cooperative.
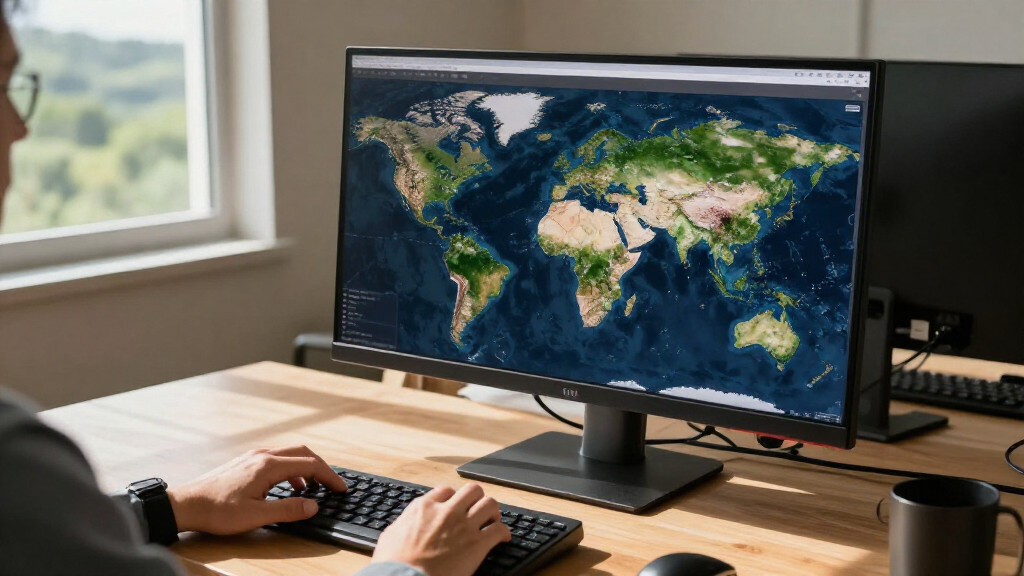
The release includes the OlmoEarth Embeddings Explorer, which displays embeddings as false-color maps, lets users switch between years and compare results with underlying Sentinel-2 imagery. According to the release description, users can select a location to find visually similar places or add labeled points to train a small classifier. The team presents the browser tool as usable without a sign-in or advanced technical knowledge.
In a comparison with AlphaEarth Foundations and Tessera v2, the developers report that the 128-dimensional embeddings ranked highest in 20 of 27 evaluations and the 64-dimensional version in 18. They say the tests covered six continents and multiple tasks. The team also introduced PLANTEUR, a crop-type benchmark focused on tropical farming, and reports that its embeddings generalized best to locations not seen by a classifier during training. The technical report contains the team’s methods and full results.
Reusable Data for Land Mapping
Precomputed embeddings may reduce the work needed to begin satellite-based mapping. Instead of downloading and processing large image archives for every project, researchers can use the shared representations to train smaller models or compare locations across years. That could help teams without dedicated GPU resources test tasks such as land-cover classification and change detection, although the output still needs to be checked against relevant imagery and other evidence.
The release also provides an alternative to the team’s earlier workflow in OlmoEarth Studio, which centered on fine-tuning a model for a particular task and running it over imagery. The developers say that process requires GPU access and the ability to download and store satellite data. Embeddings are designed to be computed once and reused across different tasks. Whether that approach performs well will depend on the region, labels and intended use—not only on aggregate benchmark rankings.
The team says it has made the model weights, pretraining data and code available. It estimates that reproducing the final pretraining run for OlmoEarth v1.3 Base would cost about $2,720 in rented H100 computing time. That is a developer estimate; actual expenses can vary with provider, availability and setup. Open materials may support scrutiny, but do not by themselves establish independent validation.
Products Worth Considering

Logitech MX Master 4 for Mac, Ergonomic Bluetooth Mouse with Haptic Feedback, Ultra-Fast Scrolling, USB-C Charging, for MacOS, iPadOS, Windo

Bose QuietComfort True Wireless Earbuds with Active Noise Cancellation, Black

Sony WH-1000XM6 Wireless Noise-Canceling Over-Ear Headphones, Blue, Bundle
As an affiliate, we earn on qualifying purchases.
From Fine-Tuning to Embeddings
The v1.3 announcement follows earlier OlmoEarth releases and shifts attention toward shared, reusable representations of satellite imagery. The team says the new model used 53% of the computing time of v1.2 and 18% of the time used for v1 to train. It also reports emissions equal to 50% of v1.2 and 22% of v1, and says v1.3 matched v1.2 in fine-tuning performance across research and partner labels. These are comparisons reported by the developers; the supplied source does not provide the emissions-accounting details needed to assess those figures.
The release illustrates change mapping with an example from Madre de Dios, Peru, comparing maps from 2017–2020 with those from 2020–2025 around La Pampa. The team links the area’s mining history to reporting by Amazon Conservation’s MAAP monitoring program and the 2019 Operation Mercurio crackdown. The source also cites an Associated Press report from August 2026 about renewed navy patrols after prosecutors found mining had crossed into Tambopata. The example shows how embeddings can flag differences between periods; the map alone does not establish what caused them.
“OlmoEarth’s 128-dimensional embeddings score highest on 20 of 27 evals and rank highest overall.”
— The OlmoEarth team
Benchmark and Coverage Questions
The evaluation results are reported by the OlmoEarth team, and the supplied material does not include an independent replication of the 27 tests. The technical report is identified as the source for methods and full results, but details such as task selection and how performance varies by region remain important for judging the claims. A high overall ranking does not show how the model will perform on every local dataset or operational mapping task.
The release description also does not specify how often annual embeddings will be updated, what coverage gaps or quality limits apply across locations, or what access and computing demands users may face when working at large scale. The Peru example carries a separate interpretive limit: a difference between yearly embeddings indicates a change in the represented landscape, but attributing that change to mining, recovery or another cause requires corroboration from imagery, monitoring records or field evidence.
Testing the Data in Use
Researchers and other users can begin exploring the published embeddings through Source Cooperative and the browser-based explorer, while consulting the team’s technical report for evaluation methods. Further testing across regions, tasks and independent datasets will help show whether the reported benchmark advantage holds beyond the developers’ evaluation. The source material does not give a schedule for future data updates or identify a next release milestone.
For practical use, users will need to compare map outputs with underlying satellite imagery and relevant local evidence, especially when drawing conclusions about the cause of change. Independent evaluation and clearer coverage and update information are the main developments to watch as the data is put into research and mapping workflows.
Key Questions
What did the OlmoEarth v1.3 release include?
It includes the v1.3 satellite embedding model, annual global embeddings at 10-meter resolution, a browser-based explorer, and materials the team says include model weights, pretraining data and code.
What does an OlmoEarth embedding represent?
It is a compact numerical representation derived from satellite imagery. For v1.3, the team says each 10-meter pixel receives a 128-dimensional vector, with its first 64 dimensions usable as a smaller representation.
Were the reported benchmark results independently verified?
Not in the supplied source material. The OlmoEarth team reports the model ranked highest on 20 of 27 evaluations, but independent replication is not provided there.
Can the maps identify why a landscape changed?
No. The embeddings can signal differences between time periods, but they do not establish whether mining, recovery or another factor caused a change. That interpretation needs checks against imagery and other evidence.
Where can users access the embeddings?
The team says the precomputed data is available through Source Cooperative. The release also includes a browser-based explorer for viewing maps, switching years and comparing results with Sentinel-2 imagery.
Primary source: Hugging Face · via ThorstenMeyerAI.com