
TL;DR
A developer has launched a web tool that visualizes London train movements in 3D, integrating TFL and National Rail data. The tool aims to improve transit tracking and user experience.
A developer has launched a web-based visualizer that tracks London trains in 3D using the TFL API and National Rail data. The tool allows users to follow train movements along the network with minimal drift, providing a new way to monitor transit in London in real time. This development offers a potentially valuable resource for transit enthusiasts, commuters, and developers interested in transit data visualization.
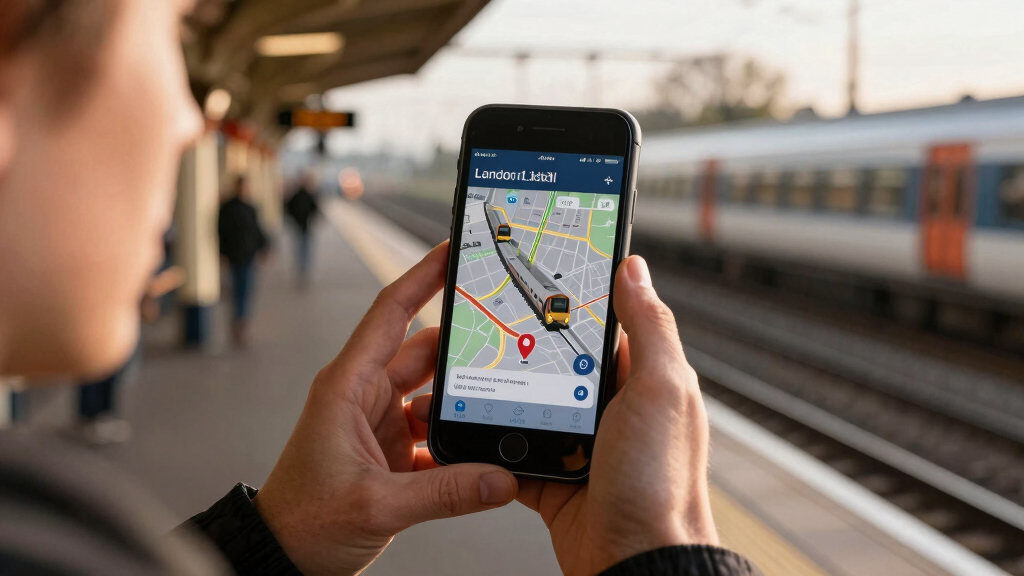
The project, shared on Show HN, uses deck.gl, a powerful WebGL-based visualization library, to render train positions in a three-dimensional space. Users can select a specific train, station, or airport to follow its journey across London’s rail network. The visualizer updates dynamically, showing train movements with minimal latency, thanks to real-time data fetched from the Transport for London (TFL) API and National Rail Enquiries.
The developer explained that the tool is designed for minimal drift, meaning it maintains accurate train positions over time, providing a reliable tracking experience. It is accessible via a web interface, where users can pick any train from a platform and observe its route, including connections to major airports like Heathrow and Gatwick. The project is still in testing, and the developer plans to add features such as historical data playback and alerts.
Innovative Transit Visualization Enhances Public and Developer Engagement
This visualizer represents a step forward in transit data accessibility and user engagement, offering a detailed, real-time 3D view of London’s train network. For commuters, it could improve trip planning and awareness of delays. For developers, it provides a foundation for building more complex transit apps, integrating live data with custom visualizations. The project highlights the potential of open APIs and modern web technologies to transform how transit information is consumed and understood.

SALIND 4G GPS Tracker for Fleet, Heavy-Duty Tracking Device for Trucks
- Easy Magnetic Installation: Attaches securely to metal surfaces
- Long-Lasting Battery: Up to 70 days standby on single charge
- Versatile and Waterproof: Suitable for vehicles, boats, and equipment
As an affiliate, we earn on qualifying purchases.
As an affiliate, we earn on qualifying purchases.
Growing Interest in Transit Data Visualization and Open APIs
Recent years have seen increased interest in open transit data and visualization tools, driven by transit authorities’ efforts to improve transparency and user experience. London’s TFL API has been a popular resource for developers, enabling a variety of apps and visualizations. This project builds on that trend by offering a more immersive, 3D perspective, which has traditionally been limited to 2D maps and static displays. The use of deck.gl, an established library for geospatial visualization, underscores the technical maturity of this approach.
While several transit tracking apps exist, few provide a real-time, 3D visualization of train movements in London. This project is among the first to leverage webGL technology in this way, aiming for both aesthetic appeal and functional accuracy. It also reflects broader interest in urban mobility and data-driven transit planning.
“This tool demonstrates how modern web technologies can bring real-time transit data to life in a way that’s both informative and engaging.”
— the developer behind the project

ARCHICAD 29 Professional Handbook: The Complete Guide to BIM Modeling, Architectural Design, Construction Documentation, Visualization, Collaboration, and Project Workflows
As an affiliate, we earn on qualifying purchases.
As an affiliate, we earn on qualifying purchases.
Limitations and Future Development Plans
It is not yet clear how accurate the real-time tracking remains over extended periods or under high network load. The developer mentioned ongoing testing, but details about data update frequency and handling of data inconsistencies are still emerging. Additionally, the scalability of the visualization for broader use or integration into existing transit apps remains to be seen.

Train Noisemaker with 16 Sounds, Train Whistles, Horns, Conductor and Engine Noises, Portable Electronic Sound Maker Train Themed Sound Board For Kids With 16 Effects, Birthday Noise Maker Toy Gift
- Number of Sounds: 16 train-themed sounds
- Sound Types: Whistles, horns, engine noises
- Portability: Compact, pocket-sized design
As an affiliate, we earn on qualifying purchases.
As an affiliate, we earn on qualifying purchases.
Upcoming Features and Broader Adoption Prospects
The developer plans to add features such as historical playback, delay alerts, and user customization options. There is also interest in expanding the visualization to include buses and other modes of transit. If successful, this project could inspire similar tools in other cities or transit systems, fostering wider adoption of web-based 3D transit visualization.

PKOLSFE Tire Pressure Monitoring System, Real-Time LCD Display TPMS with 4 External Sensors & 6 Alarm Modes, Solar/USB Charging Wireless Tire Pressure Monitor for RV Trailer Truck
- Real-Time Tire Data: Tracks pressure and temperature of all four tires
- Clear LCD Display: Easy-to-read real-time tire information
- Dual Power Options: Solar and USB charging for flexibility
As an affiliate, we earn on qualifying purchases.
As an affiliate, we earn on qualifying purchases.
Key Questions
How accurate is the train tracking in the visualization?
The developer states that the tool aims for minimal drift and real-time updates, but the exact accuracy depends on the data refresh rate and API reliability. Ongoing testing is assessing its precision over time.
Can I use this tool to plan my commute?
While the visualizer provides real-time train positions, it is primarily a demonstration project. It is not integrated with trip planning features but can help users visualize train movements and delays informally.
Will this be available for public use long-term?
The project is currently in testing and open for feedback. Its future depends on developer interest, user feedback, and potential integration with other transit apps or platforms.
Does this visualize other transport modes like buses?
At present, the focus is on trains within the London rail network. Future updates may include buses or other modes, but no official plans have been announced yet.
Source: hn